
Your Trace ID Is Not Enough
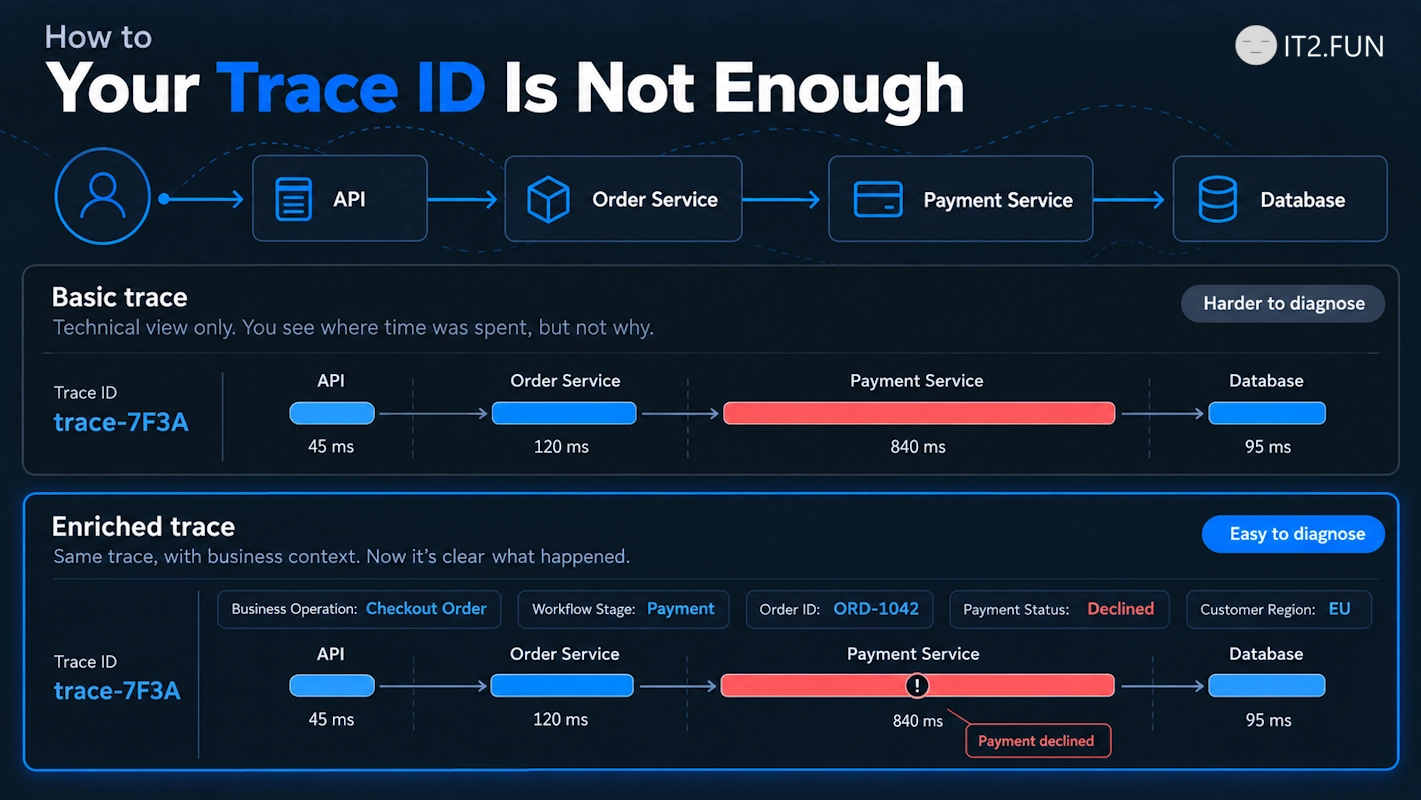
Every request has a trace ID. Every service propagates it. Your tracing dashboard shows exactly where requests traveled.
Then production breaks.
You find the failed trace, but still need to figure out which business operation failed.
A trace ID connects technical operations. It doesn't automatically explain their business meaning.
1. Technical traces lack business context
Consider this trace:
POST /api/orders        850ms
  ├── OrderService      120ms
  ├── PaymentService    680ms
  └── SQL INSERT         50ms
You know where time was spent.
But what was happening?
Was the customer placing a new order? Was this a payment retry? Was the workflow waiting for authorization?
Technical traces describe execution. They don't necessarily describe intent.
2. Add domain context to spans
OpenTelemetry supports custom span attributes.
For example:
operation.name = order.checkout
order.status = payment_pending
payment.provider = stripe
workflow.step = payment_authorization
Now your trace describes both technical execution and the business operation.
Prefer low-cardinality attributes for aggregation. Keep sensitive values out of telemetry, and place high-cardinality identifiers in appropriately controlled searchable logs or traces when supported by your backend.
3. Design observability around questions
Before adding more telemetry, identify the questions engineers need to answer:
Which business operation failed?
At which workflow step?
Which dependency caused the delay?
Is the problem isolated to one operation type?
How many operations are affected?
Instrument the system to answer those questions.
A trace ID helps you find the request.
Business context helps you understand what happened.